Home » When to Use Lean Flow Methods or Six Sigma DMAIC
When to Use Lean Flow Methods or Six Sigma DMAIC
Contents
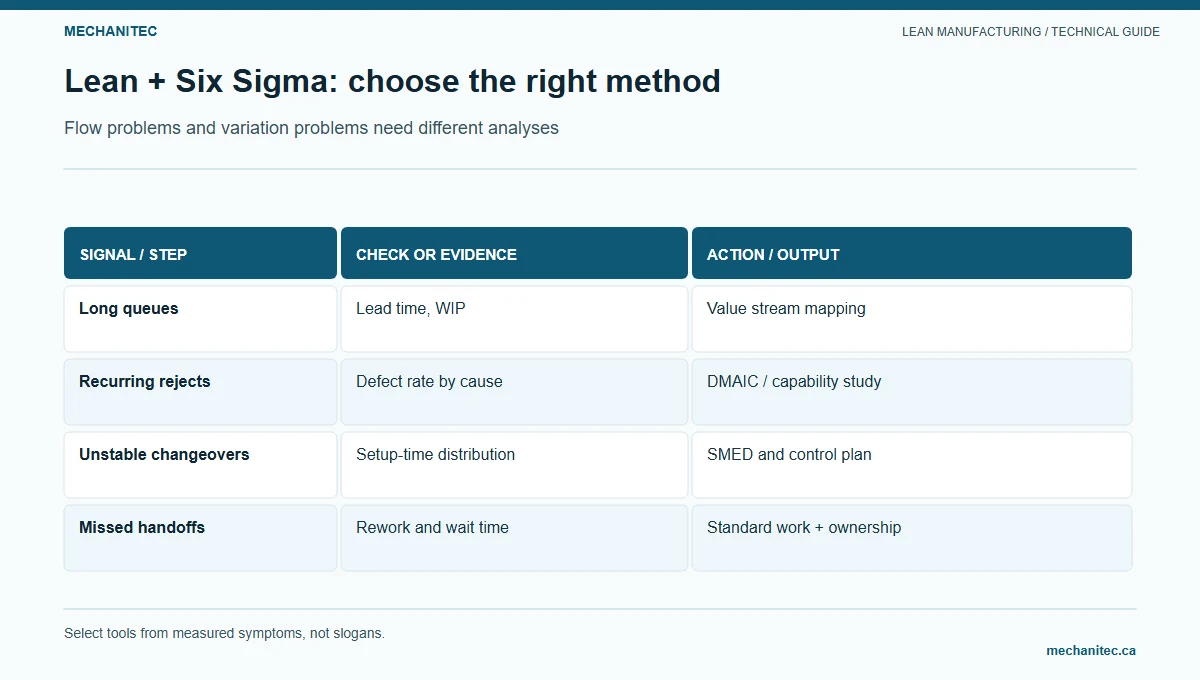
Use Lean methods when the main problem is a blocked route, excess waiting, or unclear material and information flow. Use DMAIC when a defined process repeatedly misses a measurable customer or specification requirement and the cause of variation is not yet known. A team can combine them, but it should choose the method from the evidence instead of treating the names as competing programs.
Flow problems and variation problems need different analyses. Mechanitec instructional diagram.
Choose the problem-solving path
Lean flow and DMAIC selection guide
Condition observed
Useful approach
First evidence
Limit
Jobs wait between departments or information is released late
Map the value stream and test flow or handoff improvements
Route, queue time, transfer batch, release signals, job age
A map does not identify a dimensional process cause by itself
A known, small local obstacle can be tested safely
Kaizen or a focused improvement experiment
Observed condition, baseline, owner, guardrails
Do not skip needed analysis on a high-risk or poorly understood defect
A measurable defect repeats and cause is uncertain
DMAIC: Define, Measure, Analyze, Improve, Control
Specification, operational defect definition, valid measurement, sample plan
Do not claim capability until process stability and measurement validity are established
Several factors may affect a critical characteristic
DMAIC with qualified statistical support as needed
Time-ordered data, process conditions, measurement-system review
Do not select a statistical test without checking data type and assumptions
Work a fictional dimensional reject example
A fictional machined spacer has a drawing requirement of 25.00 ± 0.10 mm. In a defined sample of 200 inspected parts, 10 readings are outside the stated limits: 6 undersize and 4 oversize. Two additional records are flagged for measurement or identification review and are not counted as confirmed nonconforming until resolved. The observed nonconforming fraction is 10 ÷ 200 = 5% for that sample. It is not automatically the long-term process defect rate, and the categories do not establish root cause.
Illustrative count of 10 confirmed out-of-spec readings
Recorded category
Parts
Share of 10 confirmed rejects
Next check
Undersize reading
6
6 ÷ 10 = 60%
Verify tool wear, setup, and measurement method
Oversize reading
4
4 ÷ 10 = 40%
Check revision, offsets, and measurement system
The example shows how to state a denominator and route categories for investigation. Do not change tool offsets or accept parts based only on these counts. Follow the authorized containment, inspection, calibration, and disposition procedures.
Do affected owners agree on the requirement and problem?
Measure
Validated measurement approach, sample plan, baseline, and time-ordered production conditions
Can the team trust the readings and denominator?
Analyze
Verified causes supported by records and process observation
Has the cause been tested rather than assumed from correlation?
Improve
Approved countermeasure and controlled pilot
Does the trial improve the characteristic without harming other requirements?
Control
Control plan, process owner, reaction plan, and follow-up data
Can the process owner detect and respond to drift?
Choose DMAIC when the defect needs evidence-led analysis
Start with the decision the team must make. If the problem is a visible queue, missing material signal, or repeated search for a standard tool, a focused Lean observation may expose a practical countermeasure. If a bore repeatedly misses a customer tolerance and the cause is uncertain, a statistical DMAIC project can organize the investigation. A 5S reset can support that project, but it cannot explain why a machined characteristic varies or prove that a new offset is safe.
Use DMAIC when the defect is measurable, recurring, significant to the next operation or customer, and not explained by an obvious approved correction. Define the critical-to-quality characteristic (CTQ), specification, affected operation, and decision owner. If the defect threatens safety, regulatory compliance, or a customer requirement, use the site’s immediate containment and escalation process first. A DMAIC charter does not delay containment, deviation approval, or notification requirements.
Before collecting data, confirm that the parts belong to the same process and that the requirement has not changed by drawing revision. If different machines, cavities, tools, materials, programs, or shifts produce the parts, record those identifiers. Mixing them can hide a local source or make an apparent process shift that does not exist. Keep a problem statement narrow enough that the team can examine the process without changing several controls at once.
Design a measurement plan before sampling
Write an operational defect definition that two inspectors can apply the same way. For the spacer example, the confirmed nonconforming condition is a valid measured diameter below 24.90 mm or above 25.10 mm against the applicable drawing revision. Record actual readings when possible, not only pass/fail marks. If the inspection method rounds to a resolution that cannot distinguish a value near a limit, resolve the measurement method with quality before comparing performance.
Use a time-ordered sample so the team can see when results occur. A convenient collection plan could record every inspected part for a defined run or a fixed interval across each shift. The sample plan must match the risk and process; a table of 200 parts from one machine on one shift cannot establish performance for three machines and two shifts. Record the number inspected, the number with a confirmed defect, the number awaiting review, and any excluded units with a reason. Do not count unresolved readings as conforming or nonconforming until the authorized disposition is made.
Shop-floor dimensional data sheet for a DMAIC study
Field
Record
Why it matters
Part and requirement
Part number, drawing revision, CTQ, lower and upper limits, units
Prevents mixing requirements or units
Process identity
Machine, fixture, tool, program revision, material lot, shift
Supports valid stratification of the data
Measurement
Actual value, instrument ID, calibration status, inspector, timestamp
Shows whether readings are comparable and traceable
Disposition
Accepted, confirmed reject, rework, or pending review
Keeps the denominator and counts auditable
Conditions
Setup change, tool replacement, interruption, or approved process change
Helps explain variation without guessing at a cause
Have the measurement-system owner assess the method when repeatability, resolution, calibration, fixture condition, or operator technique could change the result. A gauge study or other formal analysis may be appropriate, but its design depends on the measurement and process. Do not publish a capability index from a short sample until the team has established that the measurement system and process behavior suit that analysis.
Illustrative bore example: quantify the gap and test one change
Illustrative example — not observed plant performance. A machined bore has a customer specification of 25.00 ± 0.10 mm, so the lower limit is 24.90 mm and the upper limit is 25.10 mm. Over a defined baseline, the team inspects 2,000 parts and confirms 40 nonconforming readings. The observed fraction for this sample is 40 ÷ 2,000 = 0.02, or 2%. This describes the sample. It does not by itself establish a long-term defect rate, a sigma level, or the cause of the rejects.
The team first checks whether the 40 readings cluster by machine, shift, material lot, setup, or tool change. A Pareto summary can help rank verified categories, such as undersize, oversize, and surface damage, but the largest bar is a place to investigate rather than proof of root cause. The team verifies drawing revision, instrument calibration, measurement technique, and record completeness before selecting the leading category for analysis.
Suppose 24 of the 40 confirmed rejects are below the lower limit and 16 are above the upper limit. That is 24 ÷ 40 = 60% undersize and 16 ÷ 40 = 40% oversize among the confirmed rejects. The split helps the team decide which readings and process conditions to study. It does not authorize an offset change. The quality and process owners contain affected work and confirm how customer and internal requirements apply.
During Analyze, the team compares time-ordered readings and verified operating conditions. It checks whether a tool-wear pattern, setup difference, material condition, or measurement method coincides with the defect. A fishbone diagram can organize possible causes, but a cause remains a hypothesis until observations or a controlled test support it. The team avoids adjusting several variables at once because the result would not show which change mattered.
Assume the authorized owners approve a limited tool-change control trial on one machine after evidence supports tool wear as a possible contributor. A matched follow-up sample contains 500 inspected parts and 5 confirmed rejects. The observed fraction is 5 ÷ 500 = 1%. Compared with the baseline sample fraction of 2%, this is a decrease of 1 percentage point, or a 50% relative decrease in the two observed fractions. The samples may differ in mix, shifts, and time period, so the comparison is preliminary. It is not a claim of proven savings or a result to advertise without a valid study design.
Record the part mix, machine, shifts, inspection method, and all exclusions for both samples. If the follow-up includes a different product mix or a new gauge, do not treat the percentages as directly comparable without reviewing those differences. Continue an approved monitoring period and use a suitable chart or analysis selected by a qualified owner. If a reject recurs, contain the affected product under site procedures and investigate the specific condition rather than widening the control limit or removing the reading.
Use a Pareto summary and reaction plan
A Pareto table is a prioritization aid. Use mutually exclusive categories and keep the total tied to the same confirmed-reject count. If one part can have two defects, either report defect occurrences separately from affected parts or define a primary category so the parts still total correctly. State which method you used. Update the table when a cause is confirmed; do not rename a category after seeing the result just to make a countermeasure look successful.
Illustrative Pareto and response record
Category
Confirmed parts
Share of 40
Next evidence or containment step
Undersize bore
24
24 ÷ 40 = 60%
Verify gauge, machine, tool condition, and setup records
Oversize bore
16
16 ÷ 40 = 40%
Check revision, offsets, fixture, and measurement method
Total confirmed rejects
40
100%
Reconcile with inspected and dispositioned quantity
When the test ends, the team should make one of three decisions: adopt the approved control, revise the hypothesis and test, or stop the change. Adoption requires documented approval, a named process owner, the revised controlled method, training or qualification where needed, and a reaction rule for drift. If the test does not improve the CTQ or harms another requirement, restore the approved method and record why.
Control-plan reaction rules for a critical bore
Signal
Immediate response
Owner and evidence
Reading at or outside a specification limit
Contain and identify potentially affected product; follow the approved nonconformance process
Quality owner; readings, lots, time window, and disposition
Trend shifts toward a limit
Check sampling, tool condition, setup, and process records before adjustment
Process owner; time-ordered chart and approved inspection method
Measurement system is overdue or suspect
Stop comparison and resolve instrument status or method
Metrology or quality; calibration and method evidence
Countermeasure changes a controlled parameter
Do not implement until required review and approval are recorded
Engineering or process authority; change record and trial boundary
DMAIC project starter checklist
Define the CTQ, drawing revision, affected operation, customer impact, and immediate containment need.
Agree on the defect definition, denominator, units, sample window, and data exclusions.
Stratify data by machine, shift, material, tool, and setup where those factors apply.
Confirm that the measurement system can support the decision.
Use observed evidence to rank causes; do not treat Pareto, fishbone, or correlation as proof.
Approve one limited test with a control plan and safety and quality guardrails.
Record the result, decision owner, controlled-document changes, and follow-up date.
Select an analysis that matches the data
Use the response type to guide the next analysis. Actual bore measurements are continuous data; confirmed defective parts are counts or proportions; queue age and lead time are time measures. These answer different questions. A proportion can show how often a defect appeared in a defined sample, but it hides how far a bore was from the specification. Actual readings can show direction and spread, but only when the measurement method and units are valid.
Use a time plot to see the sequence and timing of changes. Stratify by a verified process factor when the sample supports the comparison. A Pareto display can organize mutually exclusive defect categories. A control chart may help distinguish common process variation from a change, but the chart type and sampling plan depend on the data and process. Ask a qualified quality or statistical resource to review assumptions before using a test or chart to authorize a production change.
Do not convert a small percentage change into an unsupported “sigma improvement.” A sigma-level statement needs a defined opportunity model and a defensible method; the reject fraction alone does not supply those assumptions. For shop-floor decisions, report the observed units, sample window, denominator, uncertainty or variation where appropriate, and practical effect on the CTQ. State what the data cannot establish.
Use capability analysis only when its prerequisites fit
Capability indices such as Cp and Cpk compare process behavior with specification limits, but they are meaningful only when the measurement system is suitable, the process is sufficiently stable for the intended analysis, and the data collection matches the process. A short mixed sample or pooled data from unlike machines and shifts can hide important differences. Involve a qualified quality or statistical resource to choose the sampling plan, chart, and interpretation.
If the immediate issue is an escape to the next operation, contain the affected work and use an approved poka-yoke or inspection change only after validation. For route and queue analysis, see the value-stream mapping guide. For prevention and validation options, see the Poka-Yoke guide.
Sources
ASQ: DMAIC — outlines the five phases and the role of measurement, capability analysis, Pareto tools, control plans, and statistical process control.