Home » Measure Environmental Waste in Lean Manufacturing Improvements
Measure Environmental Waste in Lean Manufacturing Improvements
Contents
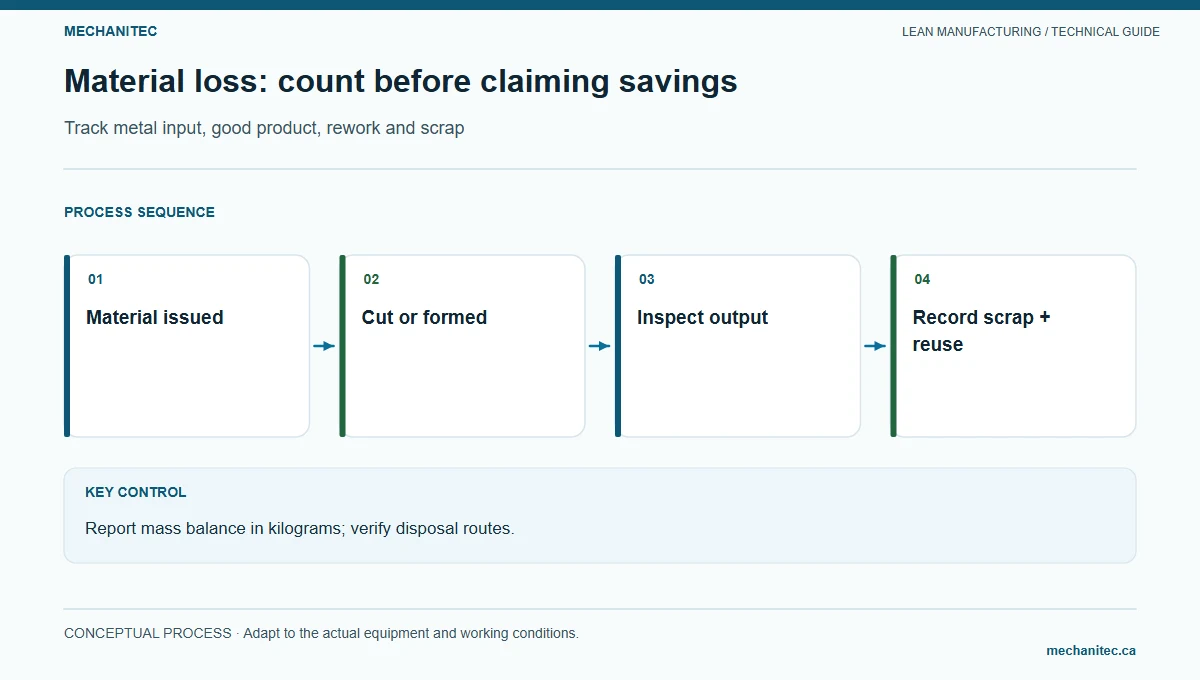
Sustainable manufacturing improvement starts with a measured process boundary, not a general promise to be greener. A plant can track material entering a process, accepted product, scrap, rework, energy, water, and waste handling to see where environmental loss and operating loss overlap. The numbers need consistent units, a clear period, and records that another person can trace.
This guide shows how to add material and energy measures to a Lean improvement. It includes a mass-balance example and an energy-intensity calculation. All example values are illustrative; they are not observed plant results and do not establish a carbon reduction or regulatory compliance claim.
Track inputs and outputs inside a defined process boundary before claiming an environmental improvement.
Set the boundary and definitions
Choose one process, product family, line, and measurement period. State whether the boundary begins at material receipt, issue to the process, or another event, and whether it ends at accepted product, shipping, or waste removal. Include all shifts and explain how planned shutdowns, rework loops, and inventory changes are handled. If the boundary changes between periods, the results are not directly comparable.
Define the output denominator as good units accepted under the site’s quality definition. Do not count unfinished work, scrap, or parts awaiting disposition as accepted product. Record rework separately and identify whether it is still inside the measurement boundary. This makes it possible to compare energy per accepted unit without hiding lost production.
Use source records suited to each measure. Material weights may come from calibrated scales, issue records, scrap tickets, and return-to-stock entries. Energy may come from a dedicated meter or a documented allocation from facility meters. Water may come from a process meter or invoice only when the allocation is defensible. Waste records should show material, classification, quantity, container, destination, and authorized handler according to site procedures.
Do not infer greenhouse gas emissions from energy alone unless the boundary, energy source, emission factor, location, period, and calculation method are documented. Do not call a process compliant based on an improvement worksheet; environmental and hazardous-material obligations remain under the site’s qualified EHS and regulatory controls.
Build a mass balance before changing the process
A basic mass balance compares material input with the outputs and the change in inventory inside the boundary. For a simple process, the relationship is: input = good product + scrap + rework or work in process retained + other documented losses. If the values do not balance within a defined tolerance, investigate missing data, scale accuracy, moisture or coating changes, measurement units, and inventory timing before claiming a yield improvement.
Track steel scrap by weight and grade where practical. Separate clean offcuts, mixed scrap, contaminated material, and items requiring controlled handling under the site’s rules. Do not assume that every material is recyclable or that a recycler accepts it. Keep incompatible or hazardous materials in approved containers and follow labels, storage, and disposal requirements.
For sheet or plate work, nesting yield may help the team compare material layouts, but the calculation must use the same accepted-part boundary and account for remnant reuse. A higher nesting yield can still create more handling or quality risk if parts are mixed or traceability is lost. A change in scrap quantity should be checked with production and EHS before the material route changes.
Illustrative steel mass-balance example
Illustrative example — not observed plant performance. Assume a fabrication process receives 1,000 kg of steel during a defined period. The scale and records show 800 kg in accepted parts, 180 kg in scrap, and 20 kg retained as rework or work in process within the boundary.
Illustrative mass balance for one process period
Material flow
Mass
Share of input
Record to verify
Steel issued into boundary
1,000 kg
100%
Issue record and opening/closing inventory
Accepted parts
800 kg
80%
Accepted production quantity and measured or validated part mass
Scrap
180 kg
18%
Scrap tickets by grade and process
Rework/WIP retained
20 kg
2%
Traveler and closing WIP record
Total accounted output
1,000 kg
100%
800 + 180 + 20 kg; balance closes
The arithmetic closes: 800 + 180 + 20 = 1,000 kg. That does not show that all 20 kg will become good product or that the 180 kg scrap is recoverable. The team must follow the rework disposition and scrap route. If the 20 kg is later accepted, rejected, or still in WIP at period end, report that status in the next measurement rather than counting it twice.
For an illustrative improvement trial, the team might test a verified nesting change on a defined product family and compare material input per accepted part, scrap mass per accepted part, rework, and part acceptance. It should keep the same material grade, part mix, measurement method, and observation period where possible. If the test changes the product mix or boundary, explain that limitation and do not label the difference a measured process saving.
Calculate energy intensity carefully
Energy intensity is energy used divided by accepted output within the same boundary. If a dedicated meter records 2,400 kWh during the period and the process produces 800 accepted parts, the illustrative intensity is 2,400 kWh ÷ 800 parts = 3.0 kWh per accepted part. Confirm that the meter covers only the process and the accepted-part count covers the same time window.
If the facility meter also includes lighting, compressed air, heating, or other production lines, document the allocation method. Do not compare an allocated estimate with a direct meter reading as if they were equivalent. If production volume changes, intensity can fall even while absolute energy use rises. Report both total kWh and kWh per accepted unit so decision-makers can see the difference.
Use submetering or a repeatable measurement plan when energy is material to the decision. Record meter ID, units, start and end readings, operating hours, product family, idle periods, and any process interruptions. Check calibration or meter condition according to the site’s metrology and facilities procedures. If the data is estimated, label it as an estimate and state the basis.
Look for environmental loss during process observation
Observe material and energy use with the operators who perform the work. Look for excess trimming, damaged material, repeated cleaning, leaks, warm-up beyond process need, idle equipment left running, unnecessary transport, and scrap that cannot be matched to a reason. These observations identify questions to test; they do not authorize changes to ventilation, machine guarding, chemical handling, cooling, or waste controls.
The U.S. EPA’s Lean and Environment Toolkit recommends integrating environmental considerations into Lean analysis, including value-stream mapping, assessment strategies, and employee involvement. A process map can add material and energy information beside cycle time, inventory, and information flow. EHS staff should help assess environmental risk and approve any changes that affect a controlled waste, chemical, or emission process.
When studying idle power, define the safe shutdown and restart conditions with maintenance and engineering. A machine that appears idle may need to maintain temperature, pressure, lubrication, or a controlled environment. Do not switch off equipment based only on a kWh chart. Record the approved operating rule and confirm that the product process remains capable after the change.
Separate process energy from facility energy. A machine meter may show electricity used by the motor and controls, while compressed air is measured centrally and lighting is outside the machine boundary. If a team allocates shared utilities, document the method and apply it consistently. A rough allocation can help identify where to investigate, but it should not be presented as a precise equipment measurement.
For water, record the activity that uses it, the metered quantity, any recirculation, and whether the measure includes cleaning or cooling. A change in water use can affect product quality, sanitation, corrosion prevention, or environmental controls. Confirm requirements with process engineering and EHS before altering a wash, rinse, cooling, or treatment cycle.
Use the same time basis for energy and output. If the meter is read monthly but production data covers only one shift, the ratio may include unrelated use. A dedicated submeter, a defined run-time allocation, or a controlled short measurement can improve the comparison. State which method was used and the uncertainty it introduces.
Before comparing periods, check whether the scale was in service, whether scrap tickets were recorded for every shift, and whether the accepted-unit count matches the same product mix. Assign a person outside the calculation to trace a small sample to original records. If a value is estimated or a record is missing, show it as a limitation and set an action to improve the data.
Control the waste route and employee safeguards
Improving segregation can reduce mixed waste and make quantities easier to measure, but only if labels, containers, and collection routes match site and local requirements. Keep hazardous and nonhazardous waste separate as required. Train affected employees, protect access to emergency equipment, and confirm who is authorized to handle or transport each stream.
Keep a copy of the waste profile, pickup record, and process owner review with the measurement period. If the waste vendor or destination changes, confirm the new route is approved before changing a container or label.
Do not create an incentive that rewards lower scrap weight while discouraging defect reporting. A lower recorded amount could mean better yield, incomplete tickets, or a change in classification. Check the physical container, process records, nonconformance log, and waste documentation together. Quality and EHS should review a proposed process change before changing disposal or material-reuse rules.
Reuse of offcuts requires the team to preserve material identity and approved dimensions. Define who verifies grade, thickness, condition, and revision before reuse. If remnants are not traceable or the reuse route creates a mix-up risk, the apparent yield improvement may weaken quality control.
Run a bounded environmental improvement
Choose a process boundary and define good-unit yield, kg input, kg scrap, rework/WIP, and kWh.
Confirm source records, measurement units, meter coverage, inventory change, and data owner.
Map material and energy use with operators, production, quality, maintenance, and EHS.
Select one cause and a reversible test that keeps safety, quality, and waste controls intact.
Record the same period, product mix, accepted output, environmental measures, and guardrails before and during the test.
Reconcile the mass balance and explain missing or estimated values.
Report absolute energy and material alongside intensity per accepted unit.
Have authorized owners approve controlled changes and waste-route updates before standardizing.
At review, report what changed, what remained uncertain, and what additional measurement is needed. Avoid calculating carbon reductions unless the energy source, conversion factor, organizational boundary, and method are documented. Avoid stating compliance or certification unless a qualified process verified it.
Measurement worksheet
For each period, record: process and product family; start and stop dates; shifts included; material input in kg; accepted output in units and kg; scrap by type in kg; rework and WIP at start and end; total energy in kWh; energy source and meter boundary; water only if measured; waste destination and record; sampling or allocation method; and the person who verified the data.
Then calculate material yield as accepted product mass divided by material input mass, if both values share a boundary. Calculate energy intensity as total process energy divided by accepted units. Retain the numerator and denominator, not only the resulting percentages. If inventory or unfinished work changes materially, explain how that affected the balance.
For example, the illustrative 800 kg of accepted parts from 1,000 kg input gives 80% accepted mass yield (800 ÷ 1,000). The 180 kg of scrap is 18% of input, and the remaining 20 kg is still rework or WIP, not accepted yield. If 10 kg is later rejected and 10 kg becomes good output, update the period and disposition records. Do not assume the retained balance becomes product merely because the math closes.
If an improvement lowers scrap per accepted unit but increases total production volume, total scrap may remain unchanged or rise. Report both intensity and absolute quantities. If the goal is reduced environmental burden, also identify what happens to the scrap after it leaves the process; a lower scrap rate does not establish what downstream treatment or recycling achieved.
Start with one reconciled material balance and one energy reading. When the records close and the boundary is clear, the team can select a test and evaluate whether it improved the process without overstating environmental results.