Apply Lean Flow in Automotive Supplier Operations
An automotive supplier can ship late even when its schedule, machines, and inventory reports look acceptable. The cause may sit at a constraint, in a feeder line, in a quality hold, or in a production signal that releases more work than the next process can finish. Start with one part family and a measured customer requirement. Map the signal, material, production steps, inspection, and shipment. Use a verified case only for claims it supports; use clearly labeled examples for the calculations your own team must make.
Start with one product family and one delivery problem
Select a part family with a repeatable route and a defined customer schedule. Include the operations and purchased components that can change its delivery performance. Record the customer’s requested quantity and dates, the schedule revision, the supplier’s authorized release, finished shipments, late orders, shortages, work in process (WIP), scrap, rework, and expediting. Define every count by part number, revision, shift, and time period.
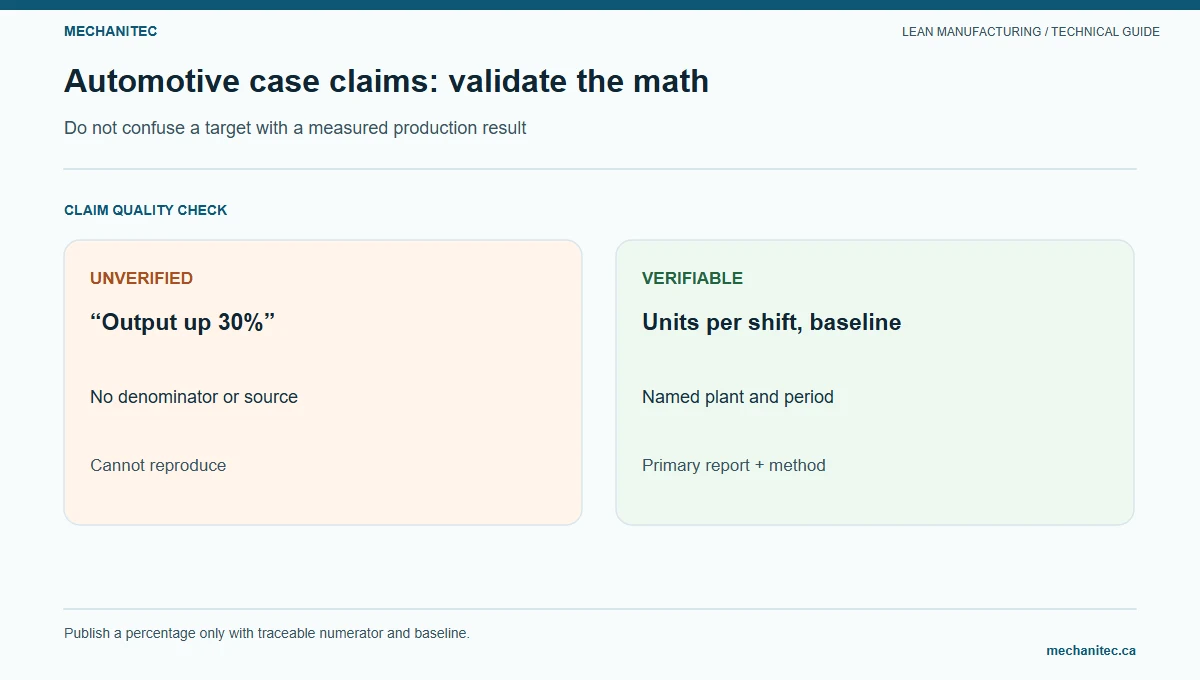
Do not start with an unsupported success percentage. An article that claims output rose by 30%, inventory fell by 50%, or defects stayed below 1% must name the source and explain what each metric counts. For output, identify the product, good-unit definition, shift, baseline dates, and comparison dates. For inventory, define whether the figure counts raw material, WIP, finished goods, or all three, and state the unit and observation method. For defects, state whether the denominator is units inspected, lots, or customer returns and whether rework counts as a defect.
Those details are not optional footnotes. Without them, a percentage can compare different schedules, products, or quality rules. A daily production count also does not tell you whether the supplier met demand, shipped the right revision, or produced acceptable parts.
Use a traceable manufacturing example carefully
The U.S. National Institute of Standards and Technology’s Manufacturing Extension Partnership (NIST MEP) published a 2024 case for Island Components Group, a precision-motion manufacturer of motors, servo actuators, and rotating components serving aerospace, defense, and space customers. NIST says the operation had subassemblies set up to produce 75 units daily for an electric motor assembly and reported work in process of 717 pieces. The New York MEP team supported training in just-in-time, jidoka, and standard work, established kanban systems for feeder lines, and provided a plan-for-every-part template. NIST reports daily output of 120 units and WIP of 156 pieces after changes it attributes to one-piece flow and bottleneck management.
This is a named, traceable industrial example, but it is not an automotive supplier case. NIST’s page does not state the observation window, a detailed measurement method, product-level quality results, or customer delivery performance. The page therefore supports only the figures and activities it reports. It does not validate the old automotive article’s 30%, 50%, or under-1% claims, and it does not show that another plant should expect the same result.
| Measure | NIST-reported starting value | NIST-reported later value | Calculation | Evidence limit |
|---|---|---|---|---|
| Daily output | 75 units per day | 120 units per day | (120 − 75) ÷ 75 × 100 = 60% increase | Page does not give comparison dates, a daily-output method, or quality-adjusted good-unit counts. |
| Work in process | 717 pieces | 156 pieces | (717 − 156) ÷ 717 × 100 ≈ 78.2% decrease | Page does not identify the inventory snapshot dates or whether every WIP location is included. |
| Delivery or defects | Not stated | Not stated | No rate can be calculated from the article. | Do not infer on-time delivery or defect performance from output and WIP totals. |
The calculations are arithmetic on the two values published by NIST. They are not additional NIST-reported percentages. Because the source does not give the observation window or full denominator definitions, preserve those limits whenever you cite the numbers.
Map schedule signals, material, and quality gates
A current-state map should show how information and parts move from the customer’s release to shipment. Lean Enterprise Institute describes heijunka as leveling the type and quantity of production over a fixed period. Leveling is not a command to make every part at a constant rate. It requires a suitable demand pattern, a workable schedule point, controlled replenishment, and an agreed buffer where needed. The supplier must also preserve customer-specific schedule, labeling, packaging, traceability, and approval requirements.
| Flow point | Record | Check | Owner |
|---|---|---|---|
| Customer schedule | Release version, firm quantity, forecast, requested ship date, change notice | Which message authorizes production? Which values are planning signals only? | Customer planner or supplier scheduling lead |
| Purchased components | Approved source, lead time, received quantity, shortage and substitution history | Does a material signal match the required part and revision? | Buyer and receiving |
| Production release | Order authorization, part revision, work center, release date, WIP age | Is release limited by the next process’s capacity and quality status? | Production control |
| Constraint operation | Good output, cycle time, downtime, changeover, scrap, skill coverage | Can this step meet the schedule mix without overtime or hidden queues? | Process owner |
| Inspection and containment | Control plan, checks, nonconformance, hold and disposition timestamps | Can suspect product be identified and contained before shipment? | Quality |
| Shipment | Pack quantity, label, ship date, carrier, customer receipt and shortage record | Does the result match the customer’s requested date and specification? | Shipping and customer service |
Walk the actual route and reconcile the board with physical WIP. Mark where each unit waits, where a batch forms, and where the next process gets its instruction. Record normal replenishment and exceptions separately. A material queue may be necessary to protect a long or variable supplier lead time; the improvement question is whether its size, revision control, and replenishment rule fit the risk.
Include inspection and rework in the map. A quality hold is not simply another inventory pile: it protects the customer from suspect product. Preserve the authorized hold, escalation, disposition, and release process. If a change affects a control plan, process parameter, fixture, supplier, or customer-specific requirement, follow the required approval path before the change reaches production.
Balance a hypothetical one-shift line
Illustrative example — not observed plant performance: assume a single shift has 420 minutes available after scheduled breaks and planned meetings, and a customer requires 100 good units for the selected day. Takt time is the available production time divided by customer demand:
420 minutes per shift ÷ 100 good units per shift = 4.2 minutes per good unit.
Now suppose the measured cycle times in a fictional route are 3.4 minutes per unit at cutting, 4.7 at machining, 3.2 at deburring, and 4.3 at inspection. The slowest step is machining at 4.7 minutes. At that rate, the theoretical shift capacity is 420 ÷ 4.7 = 89.36 cycles, or about 89 units before allowance for downtime, scrap, breaks beyond the stated allowance, or mix effects. The constraint is about 11 units short of the 100-unit requirement even in this simplified calculation. That gap calls for a capacity and loss study; releasing more WIP will not remove it.
| Step | Cycle time (min/unit) | Theoretical units in 420 min | Compared with 4.2 min takt | Question before changing the process |
|---|---|---|---|---|
| Cutting | 3.4 | 420 ÷ 3.4 = 123.5 | 0.8 min below takt | Does the route and material feed keep this capacity available? |
| Machining | 4.7 | 420 ÷ 4.7 = 89.4 | 0.5 min above takt | Which loss causes the gap: cycle, changeover, downtime, staffing, or quality? |
| Deburring | 3.2 | 420 ÷ 3.2 = 131.3 | 1.0 min below takt | Is a FIFO limit needed to prevent excess upstream release? |
| Inspection | 4.3 | 420 ÷ 4.3 = 97.7 | 0.1 min above takt | Is this an actual constraint or does the inspection mix differ? |
The rates in this table divide shift minutes by a single stated cycle time. They are theoretical comparisons, not forecasts. Real capacity depends on product mix, availability, staffing, yield, maintenance, and approved inspection requirements. Check the method with production and quality before using a calculated shortfall to set a customer commitment.
Size a feeder buffer from verified consumption
A feeder line supplies parts or subassemblies to a downstream operation. In a pull system, the downstream need signals replenishment upstream. A kanban card or electronic signal must identify what to replenish, how many, where, and under which revision or source rule. It does not authorize a substitute, change a drawing, waive inspection, or override a customer release.
Illustrative buffer calculation — not a recommended inventory target: assume verified consumption of 100 units per day, a replenishment lead time of 0.25 day, a provisional 20% uncertainty allowance, and containers of 10 units. A simple starting estimate is:
Cards = daily demand × replenishment lead time × (1 + allowance) ÷ container quantity
100 units/day × 0.25 day × 1.20 ÷ 10 units/container = 3 containers.
This arithmetic is only a discussion starter. Confirm whether the lead time is stable, whether the supplier can replenish in smaller quantities, and whether the buffer could become obsolete after an engineering change. Set a maximum quantity, owner, review interval, shortage signal, and change-control rule. Compare actual consumption and replenishment misses before adjusting the number of cards.
Use a sourcing ledger for every performance claim
Keep a short evidence ledger when an article, presentation, or improvement report includes a result. The ledger makes it easier for a reviewer to reproduce the calculation and see where the evidence ends.
| Metric | Definition and unit | Time window | Denominator or base | Source and permitted claim |
|---|---|---|---|---|
| Island Components output | Reported units per day | Not stated on source page | NIST reports 75 then 120; good-unit and shift method not stated | NIST MEP case page. Attribute both figures to NIST; do not add unreported quality or customer results. |
| Island Components WIP | Reported pieces | Snapshot dates not stated | NIST reports 717 then 156 pieces; included locations not defined | NIST MEP case page. Attribute the values and the change to NIST; do not claim a universal target. |
| Line takt example | Available minutes per shift ÷ required good units per shift | One fictional shift | 420 min and 100 units, both illustrative assumptions | Calculation shown in this article; not a plant observation or customer commitment. |
| Feeder buffer example | Containers based on consumption and lead time | 0.25-day illustrative lead time | 100 units/day, 20% allowance, 10 units/container | Calculation shown in this article; verify local demand, lead time, and policy before use. |
If a cited source gives no period or denominator, write “not reported by the source.” Do not fill the gap with a guess. If your own pilot produces a result, record the start and end dates, product and revision, good-unit definition, schedule changes, quality safeguards, and exclusions before you calculate a percentage.
Protect quality, traceability, and supplier readiness
Lean Enterprise Institute describes jidoka as detecting an abnormal condition and stopping work so that quality problems become visible at their source. In a supplier environment, use the site’s approved quality system to define who can stop work, identify suspect product, preserve traceability, notify the customer, and authorize restart. A visual signal supports that process; it does not replace it.
Do not create one-piece flow where it would violate a validated process, safety condition, equipment constraint, customer requirement, or economical batch requirement. Do not lower inspection or sampling controls simply to reduce lead time. If process variation makes a fixed replenishment rule unreliable, first stabilize the process, verify the demand signal, and set a controlled exception route.
Supplier readiness matters as much as internal flow. Before reducing stock or changing delivery frequency, review supplier lead time, minimum order quantities, transport, quality history, capacity, and engineering-change communication. Protect revision identity in receiving, storage, point-of-use presentation, and return of excess material. If supply risk is high, a documented buffer may be prudent; its owner must monitor age, condition, and revision status.
Run a bounded pilot and review the evidence
Choose one part family, one schedule rule, and one constraint or feeder. Record a baseline long enough to include normal mix and schedule variation. State which outcomes you will compare: on-time shipment against the customer date, good output, WIP by location, shortages, expediting, first-pass acceptance, and customer disruptions. Note any change in demand, equipment, staffing, or product revision that could affect the comparison.
Review the result with production, materials, engineering, and quality. Stop the trial if it causes a traceability gap, uncontrolled stock, missed quality checks, unsafe handling, or a customer delivery risk. If one measure improves while another worsens, report both. A rise in gross output does not prove better flow if WIP, defects, or late shipments also rise.
For a different plant’s measured experience, NIST MEP reports the Island Components example described above; the source is useful context, not a forecast for your line. For replenishment cards and signal design, see the Kanban manufacturing guide. For supplier readiness, shortages, and point-of-use flow, use the supplier-flow guide.
Start with these checks
- Select a part family and confirm the customer schedule version.
- Assign one owner to walk the route from schedule receipt to shipment.
- Measure good output, WIP location, constraint cycle time, shortages, and quality holds.
- Separate customer results from production targets and illustrative calculations.
- Verify the release and feeder signals with production control and materials.
- Keep quality, traceability, engineering-change, and customer approval rules active.
- Review the pilot’s dates, part mix, denominator, and adverse effects before stating a result.
Sources
- NIST MEP: Success Lean Process Implementation — Island Components Group — source for the named company, reported daily output, reported WIP, and MEP-supported activities discussed here.
- Lean Enterprise Institute: Heijunka — definition and scope for leveling production type and quantity over time.
- Lean Enterprise Institute: Jidoka — definition related to detecting abnormal conditions and stopping work to build in quality.