Home » Reduce Supplier and Material-Flow Risk in a Lean Supply Chain
Reduce Supplier and Material-Flow Risk in a Lean Supply Chain
Contents
Improve a replenishment loop by measuring actual supplier lead time, material readiness, and shortage consequences before changing order frequency or stock. Lean supply-chain work depends on reliable information and a response plan for variation. A lower on-hand count alone does not show that service improved.
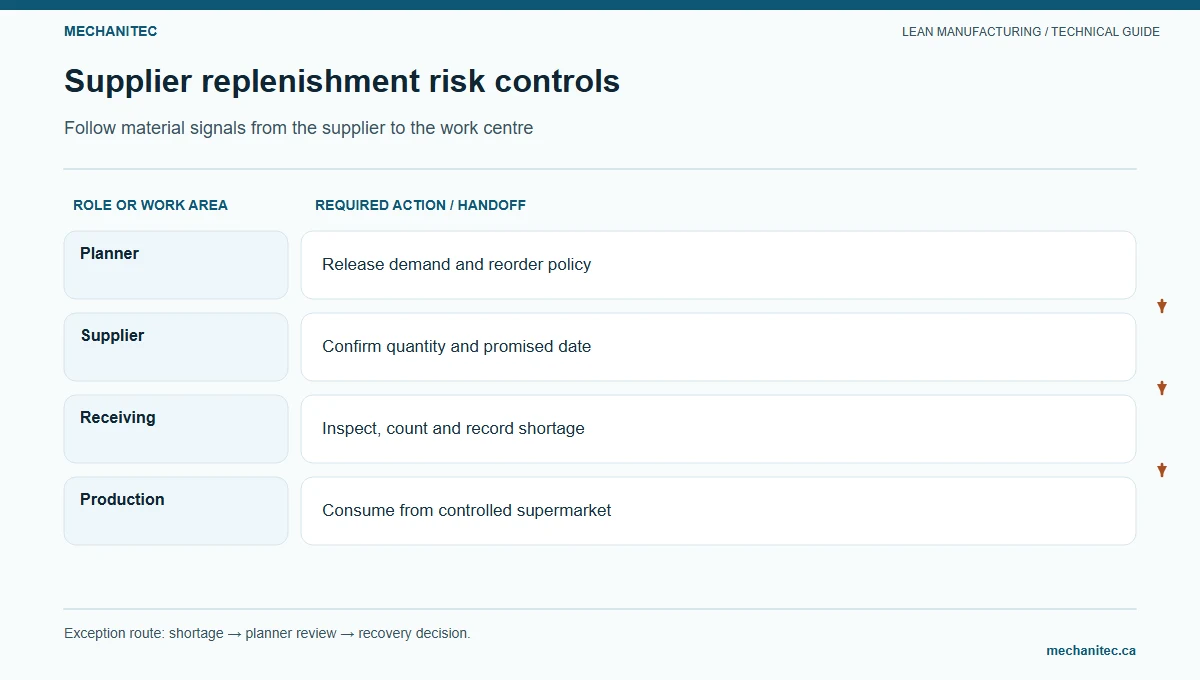
Follow material signals from the supplier to the work centre. Mechanitec instructional diagram.
Map the supplier-to-point-of-use information flow
For one high-use item, trace the signal from production consumption to replenishment and receipt. Record which system or person sends the forecast, purchase order, release, ship notice, receipt, inspection status, and point-of-use delivery. Separate a planning forecast from a firm release, and distinguish supplier ship time from the full time until accepted material is usable.
Material and information flow map for one purchased item
Event
Owner
Timestamp or record
Risk to check
Demand signal
Planner
Forecast, schedule, or actual pull signal
Does supplier know which quantity and date are firm?
Order acknowledgement
Purchasing and supplier
Accepted quantity, promise date, revision
Does acknowledgement match the release?
Supplier dispatch
Supplier and carrier
Ship time, quantity, lot, and tracking
Are partial shipments or transit delays visible?
Receipt and quality status
Receiving and quality
Arrival time, inspection, hold or acceptance
Is held material excluded from usable stock?
Point-of-use delivery
Material handler
Accepted quantity at the consuming operation
Does the cell have the correct item when required?
Measure lead-time and delivery variation
For each receipt, calculate lead time from the same start event (for example, accepted purchase-order release) to the same end event (accepted material available at point of use). Keep working days or calendar days consistent. Review the sample count, median, range, late quantity, and reasons by supplier and item. A short history may miss rare disruptions, so do not treat the observed maximum as a guaranteed upper bound.
Minimum order quantities, order multiples, supplier capacity, transport frequency, inspection time, and product revision all affect the replenishment design. Ask the supplier to validate the agreed signal, pack, delivery window, and escalation contact. A scorecard should support shared problem solving, not hide the conditions the buyer controls.
Supplier readiness scorecard; record evidence and review date for each item
Check
Evidence
Status
Owner and next action
Lead-time definition
Start/end event and unit are agreed
Ready / gap
Planner and supplier confirm timestamps
Promise reliability
Actual versus confirmed delivery by item and date
Trend / gap
Purchasing reviews misses and cause
Quality acceptance
Lot status and required traceability are visible
Ready / hold
Quality defines disposition and notification
Capacity and variation
Demand changes, shutdowns, and constraints are communicated
Known / unknown
Supplier contact and planner agree update route
Pack and transport
Container, order multiple, transit, and receiving process
Fit / mismatch
Material handler tests handling and storage
Disruption response
Escalation contact and approved substitute rules
Defined / missing
Purchasing and quality verify contingency
Compare push planning with a pull loop
Material requirements planning (MRP) uses demand, bills of material, inventory, and planned lead times to calculate supply needs. A pull loop uses a downstream signal to authorize replenishment of a defined item and quantity. Many shops need both: MRP can plan long-lead and variable items, while a controlled supermarket can replenish stable, frequent-use parts. Choose based on the item’s demand pattern, supplier capability, and process reliability.
Do not implement pull on every purchased item by default. For a stable item with repeat consumption and short reliable replenishment, a tested container loop may simplify local control. For sporadic, engineered, expensive, regulated, or long-lead items, order-specific planning and a separately managed risk buffer may be safer.
Estimate the carrying cost without confusing it with total cost
Illustrative worksheet: if a buffer holds 50 units at a recorded unit value of $40, average inventory value is 50 × $40 = $2,000. At a fictional annual carrying-rate assumption of 20%, the carrying-cost estimate is $2,000 × 0.20 = $400 per year. Confirm the company’s approved rate and what it includes. This estimate excludes shortage cost, obsolescence risk, quality inspection, purchasing, transport, and cash-flow effects; it is not a recommendation to reduce 50 units.
Escalate a shortage and test a replenishment change
Identify the item, revision, affected jobs, quantity, required date, and usable stock.
Protect customer commitments and quality controls; do not use held or unapproved material.
Notify the planner and purchasing owner; confirm supplier status and the next reliable update.
Use only authorized substitutes or expedite methods; record added costs and delivery effects.
After recovery, review the cause with the supplier and process team and update the replenishment assumptions.
For a pilot, select one item, baseline shortages and accepted lead time, test the signal or order rule, and review actual inventory, service, expedite cost, and quality holds together. Stop the change if supply risk increases or acceptance controls fail.
Build a replenishment estimate from measured inputs
A pull signal must identify the part, revision, trigger, quantity, route, and response owner. Choose one purchased component with a clear point of use. Collect actual daily consumption, supplier lead time, delivery frequency, pack quantity, and the time the operation can tolerate a delay. Separate the normal lead time from the observed late-delivery range. An average alone can hide a disruption that causes a shortage.
For a fictional fastener, assume consumption of 120 pieces per production day, replenishment lead time of 1.5 production days, an approved 20% allowance for variation during a pilot, and 25 pieces per container. A simple starting estimate is cards = ceiling(daily demand × lead time × (1 + allowance) ÷ container quantity) = ceiling(120 × 1.5 × 1.20 ÷ 25) = ceiling(8.64) = 9 cards. Nine containers represent up to 225 pieces, or 1.875 average production days at that consumption rate. The allowance and count are planning assumptions; they do not guarantee supply continuity.
Before release, validate the lead-time clock, production calendar, actual pack quantity, storage space, quality status, and consequence of a late replenishment. If demand varies sharply by mix or supplier performance is unstable, a fixed card count may be unsuitable. Obtain approval from production control, purchasing, quality, and the supplier contact as needed. Name the role that can adjust the signal and the condition that requires reverting to the approved planning method.
Supplier and replenishment readiness review; fictional checklist
Readiness question
Evidence to inspect
If not ready
Is the part and revision unambiguous?
Approved part master, drawing revision, and supplier specification.
Resolve engineering and purchasing records before changing the signal.
Can point-of-use demand be measured?
Issue or scan history reconciles with physical consumption.
Fix the transaction or count method and establish a baseline.
Is actual replenishment time known?
Order release, supplier ship, receipt, inspection, and put-away timestamps.
Measure each interval; do not use quoted lead time as elapsed time.
Can the supplier support the cadence?
Capacity, minimum order, transit, delivery window, and change notice.
Use an agreed schedule until response is reliable enough for a pilot.
Is incoming status visible?
Inspection rules, accepted-stock location, hold path, escalation owner.
Keep uninspected or held stock from appearing available to production.
Is disruption response assigned?
Named contacts, approved alternate, and product-risk decision route.
Agree on response and authority before reducing planned coverage.
Choose push planning or a controlled pull loop
Push planning releases work from a forecast or schedule. A pull loop authorizes replenishment when a defined downstream consumption signal occurs. Neither method fits every part. A stable, repeatable component with reliable replenishment may fit a small supermarket or two-bin loop. A custom component, unstable lead time, engineering-change risk, or supplier minimum order may need planned ordering with explicit exception management. A system is not pull if its cards are generated only from a forecast without a consumption trigger.
For two-bin replenishment, define what happens when the first bin empties: the operator moves its card or scans the agreed signal, consumes from the second bin, and the material handler or supplier replenishes the first before the second is exhausted. Identify which bin is available, in transit, or held. Explain how a damaged, short, or nonconforming delivery is handled. Train both shifts and simulate one full cycle before relying on the loop for production.
Maintain an exception log for missed delivery, quantity variance, quality hold, demand change, engineering revision, and transaction error. Record the part, expected and actual dates or quantities, production impact, owner, immediate containment, and recovery decision. Review repeated causes with purchasing, supplier quality, planning, and production. A card count cannot correct an inaccurate inventory record or unresolved quality issue.
Estimate carrying cost without overstating savings
Inventory carrying cost is not the purchase price of the stock. A simple estimate for average inventory is average units × unit value × annual carrying-rate assumption. If a fictional item averages 225 units at $2 each and finance approves an assumed annual rate of 20%, the estimate is 225 × $2 × 0.20 = $90 per year. This calculation is illustrative. It does not include ordering, transportation, stockout, obsolescence, or the cost of a production interruption. Use finance-approved rates and a consistent time basis before preparing a business case.
When comparing a lower quantity, show service risk and total operating effects beside the carrying-cost estimate. A smaller buffer may reduce average inventory while raising expedite expense, shortage exposure, changeover risk, or inspection congestion. A larger quantity may be justified for a critical component with unstable lead time, but document the reason and review date. Do not claim savings until finance validates the cost treatment and the team measures actual inventory change.
Run a bounded replenishment pilot
Choose one part family and document current stock, shortage events, consumption, lead-time distribution, supplier conditions, and inventory transactions. Set the pilot duration, maximum and minimum quantities, permitted adjustment owner, and stop conditions. Stop or return to the approved planning method if the signal is missed, stock status becomes ambiguous, required inspection is bypassed, or an order is at risk.
Review the pilot weekly using shortage count or service level, replenishment response time, inventory on hand, transaction accuracy, expedite events, and quality holds. Keep the numerator and denominator beside every rate. Compare with a baseline covering the same part and calendar. At the end, decide whether to retain, adjust, or stop the loop and record the evidence. Supplier readiness is a measured operating condition and working agreement, not an assumption built into a formula.
Distinguish normal replenishment from an exception
For the fictional fastener, record each replenishment cycle from signal release through usable stock at the point of use. The exact start and end events matter: supplier ship date is not the same as inspected, available material. A sample log can include signal date and time, order or card identifier, requested and received quantities, arrival time, inspection completion, put-away time, shortages, and owner. Use the same timestamps for every cycle before calculating lead time. If inspection is required, exclude the shipment from available stock until it passes the site’s release process.
When a cycle exceeds the agreed lead time, classify the reason using evidence: supplier capacity, transportation delay, purchasing release, receiving backlog, inspection hold, inventory transaction, or a demand change. Record both the planned response and actual recovery. This lets the team distinguish an external supplier issue from an internal release or receiving delay. If the cause is unknown, keep it unknown and assign an investigation instead of selecting the nearest convenient code.
Weekly pilot scorecard for a replenishment loop; use local baseline values
Measure
Definition to write down
Review question
Shortage events
Count of times required material was unavailable at use.
Did an event stop or reorder production, and who contained it?
Replenishment lead time
Elapsed time from the defined signal to released stock at point of use.
Which interval explains the longest delay?
Inventory on hand
Usable units by location and quality status at the same review time.
Do physical count and system quantity reconcile?
Signal accuracy
Signals with correct part, revision, quantity, and transaction ÷ signals reviewed.
Which data field or work step generated a mismatch?
Expedites and quality holds
Separate event counts with part and cause.
Did lower stock increase cost or risk outside the carrying-cost estimate?
Use a stable weekly cut-off and show counts with rates. For example, report seven correctly completed signals out of eight reviewed, or 87.5%, and keep the eight-signal sample visible. A single week is not enough to establish supplier capability. Review whether orders fell inside or outside the agreed window and involve the supplier when the evidence points to a shared process issue.
Check common failure modes before scaling
A card can be lost, duplicated, or separated from the container. Define a backup transaction and reconciliation step that preserves the signal history. If the part number or revision changes, stop the old signal and use the approved engineering-change process before replenishing a superseded item. If the supplier changes pack quantity, update the container assumption and recalculate only after the responsible owner approves the new method.
Do not scale a pilot while physical inventory and the system record disagree, while quality holds are mixed with available stock, or while a supplier’s actual lead time exceeds the chosen protection. Resolve the specific condition or return to the current planning control. For a critical component, the business continuity plan and authorized risk owner determine the appropriate protection; a simple average-demand formula cannot set that policy.
At pilot close, compare shortage events, inventory, expedites, transaction errors, and quality status with the documented baseline. Record which assumptions held, what changed, and who owns ongoing review. If the loop works for one part family, assess each new family on its own demand, lead time, supplier, quality, and revision risks rather than copying the same number of cards across the store.