Home » Addressing the Challenge of Equipment Efficiency in Lean Implementation
Measure Equipment Losses Before Improving Machine Efficiency
Contents
Improve a machine constraint by identifying the loss that limits good output during the time customers need it. Overall equipment effectiveness (OEE) can summarize availability, performance, and quality for a defined production window. It does not explain the cause by itself, and a higher OEE is not automatically better if the machine makes work that is not needed.
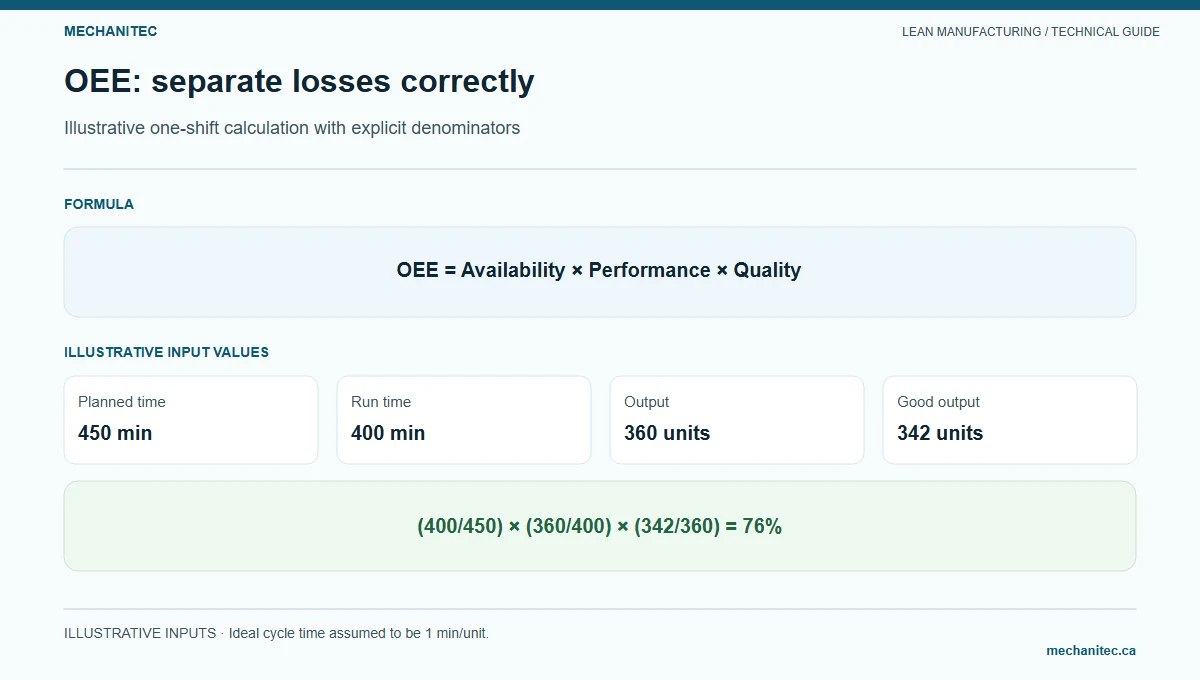
Illustrative one-shift calculation with explicit denominators. Mechanitec instructional diagram.
Define the time window and operating context
Choose one machine, product family, shift, and reporting window. Define planned production time, what counts as downtime, the ideal cycle time for the product, and the quality acceptance point. Keep planned breaks, changeovers, maintenance, and no-demand time consistently inside or outside the denominator according to the purpose of the measure. Document the rule so shifts do not report different versions of OEE.
Calculate OEE from its three factors
For a consistent reporting boundary:
Availability = run time ÷ planned production time.
Performance = ideal cycle time × total count ÷ run time.
Quality = good count ÷ total count.
OEE = availability × performance × quality.
Illustrative press-brake shift calculation; fictional values for explaining the method
Input
Example
Calculation
Planned production time
420 minutes
After the site-defined scheduled exclusions
Unplanned stop and adjustment time
42 minutes
Run time = 420 − 42 = 378 minutes
Availability
90%
378 ÷ 420
Ideal cycle time and total count
1.5 min/piece; 240 pieces
Performance = (1.5 × 240) ÷ 378 = 95.2%
Good count
235 pieces
Quality = 235 ÷ 240 = 97.9%
OEE
83.9%
0.900 × 0.95238 × 0.97917 = 0.8393, rounded to 83.9%
Use unrounded factors for the final calculation. The rounded row values above can produce a small display difference. Confirm that the ideal cycle time is valid for this product and process; do not use an aspirational target as if it were a demonstrated rate.
Separate required internal setup from avoidable waiting
Minor stoppage
Short stops by repeatable cause where collection is reliable
Confirm the event definition and investigate recurring causes
Reduced speed
Actual cycle versus validated ideal cycle for product and conditions
Check method, tooling, material, and approved process limits
Scrap and rework
Quantity, defect code, point made and point found
Contain affected work and use the quality system
Do not create false precision by manually timing every brief stop if the measurement method cannot capture it consistently. A simple event log with clear categories can be more useful for a small shop than a dashboard with unreliable data.
Choose the next maintenance or process action
Sort losses by total minutes and repeat frequency, not by the most visible anecdote.
Check whether the loss is within the team’s control and whether maintenance, engineering, quality, or a supplier must participate.
Select one countermeasure and define an expected change in the specific loss category.
Protect guarding, lockout/tagout, qualified setup, inspection, and customer requirements.
Re-measure under comparable product, shift, and schedule conditions; report the sample and exceptions.
In a fabricated bracket cell, a high breakdown total might justify a maintenance cause review. A high adjustment total might instead call for observing setup tasks. A high quality loss requires containment and defect analysis before output targets change. Treat these as different problems with different owners.
Know when OEE can mislead
Comparing different products without product-specific ideal cycle times can distort performance.
Changing planned-time rules can make the score rise without changing production.
Running faster can increase scrap or create downstream WIP; review quality and flow measures together.
Improving utilization on a non-constraint can increase inventory without improving customer delivery.
Never use OEE as a reason to bypass safe work, required maintenance, inspection, or a quality hold.
Before calculating Overall Equipment Effectiveness (OEE), agree on the equipment boundary, product family, shift, time window, and treatment of planned downtime. OEE is commonly calculated as Availability × Performance × Quality. Availability compares operating time with planned production time; Performance compares ideal cycle time for actual total output with operating time; Quality compares accepted output with total output. Each factor needs a defined clock, unit, and source. If a machine runs several products with different cycle times, calculate ideal time from the product mix rather than applying one convenient cycle to every piece.
For one fictional press-brake shift, assume 480 scheduled production minutes, 60 minutes of recorded downtime, an ideal cycle of 2 minutes per part for the product mix, 190 total parts, and 180 accepted parts. Operating time is 480 − 60 = 420 minutes. Availability is 420 ÷ 480 = 87.5%. Ideal production time is 190 × 2 = 380 minutes, so Performance is 380 ÷ 420 = 90.48%. Quality is 180 ÷ 190 = 94.74%. OEE is 0.875 × 0.9048 × 0.9474 = 75.0% after rounding. Keep full precision until the final display; displayed rounded factors may produce a slightly different product.
This example assumes all 480 minutes were planned production time and the 60 downtime minutes are mutually exclusive from output and quality losses. If the plant excludes breaks, meetings, or changeovers from planned time, state the rule and apply it consistently. Do not compare a figure calculated with a different denominator as if it were the same measure.
Illustrative one-shift OEE record with definitions and arithmetic
Measure
Input and formula
Result
Planned production time
Scheduled time under the stated local rule
480 min
Operating time
480 − 60 min downtime
420 min
Availability
420 ÷ 480
87.50%
Performance
(190 parts × 2 min) ÷ 420 min
90.48%
Quality
180 accepted ÷ 190 total parts
94.74%
OEE
0.875 × 0.9048 × 0.9474
75.0% (rounded)
Capture losses at the event, then verify the codes
A shift sheet should capture start and end time, equipment or line, product and revision when relevant, planned time, each stop’s start, end, duration, reason, response, and restart confirmation. It should also record total output, accepted output, rejects, rework status, and the approved ideal cycle source. Use a short initial loss-code list that operators can distinguish at the machine. Examples include breakdown, setup or adjustment, material wait, quality check or hold, minor stop, speed loss, and scrap. The final categories must match the operation and site definitions.
Review ambiguous codes with operators and maintenance before using the data to rank people or allocate capital. If one stoppage appears in two categories, define the primary code and preserve secondary detail in the notes. Check whether the machine clock, manual log, and production system agree on a sample shift. Missing or conflicting timestamps are a data-quality issue; do not replace them with estimates without labeling the estimate and its source.
Minimum event fields for a one-shift equipment loss log
Field
Entry rule
Why it matters
Time and equipment
Start, end, asset, shift, and date
Supports a duration calculation and stable scope.
Product and cycle source
Part family, revision if needed, approved ideal cycle reference
Prevents the wrong cycle time from distorting Performance.
Event code and note
One primary code plus a brief observable condition
Allows repeat losses to be grouped without guessing.
Output by disposition
Total, accepted, scrap, and rework under local definitions
Keeps Quality’s denominator explicit.
Response and restart
Person or role, action, restart time, open follow-up
Connects the loss record to a verifiable next step.
After one week, sort verified loss minutes by cause. A Pareto chart is useful only if categories are consistent and enough events were captured. For the largest repeat loss, inspect the work where it occurs and ask what condition triggers it, who sees it, and what evidence would confirm the cause. A maintenance action may address a recurring failure; a setup action may need a separate changeover study; a material wait may be owned by planning or supply. OEE points to measured time or output losses. It does not identify their root cause by itself.
Choose a countermeasure and define its proof
For each proposed action, name the loss it targets, owner, test window, production and safety constraints, and expected observable change. A lubrication inspection, spare-part response, setup check, or sensor adjustment must follow the equipment maker’s requirements and site maintenance controls. Do not bypass a guard, interlock, inspection, or approved setup to improve the metric. Agree on a stop rule if the action creates a defect, unsafe condition, or unstable cycle.
Example loss-to-action review; fictional entries require local confirmation
Loss signal
First check
Candidate owner
Evidence to close
Repeated short stops
Observe a full cycle and classify each stop consistently.
Operator and process engineer
Event count and duration before and after using the same window.
Unplanned downtime
Compare failure log with work orders and parts history.
Verify product mix, ideal cycle source, and required manual steps.
Process engineer
Observed cycle distribution with quality and safety controls intact.
Rejected output
Stratify by defect and confirm the inspection denominator.
Quality and process owner
Accepted/total counts and verified corrective-action follow-up.
Compare the same shift, product mix, planned-time rule, and loss definitions before and after the change. Report raw minutes, total and accepted parts, downtime event count, and OEE factors beside the percentage. If demand is below capacity, a higher utilization target may create excess production rather than customer value. The purpose is reliable flow for required demand, not keeping every machine busy.
Check the limits before using OEE as a target
OEE can be distorted when teams change planned-time definitions, ideal cycles, product mix, stop thresholds, or quality disposition rules between periods. It can also hide a bottleneck outside the measured machine. A cell may report higher OEE while work accumulates in inspection, material handling, or the next operation. For shipment performance, pair equipment measures with schedule attainment, queue age, and the constraint’s actual demand. Do not assume the equipment with the lowest OEE is the system constraint.
Use OEE to start a problem-solving conversation, not as an individual performance score. A target of 100% can encourage unsafe speed, postponed maintenance, hidden defects, or production that no customer needs. Where the equipment is not required during part of the scheduled window, the planned-time policy must describe that fact rather than labeling the gap an operator loss. The process owner should approve the definition and retain it with the report.
A practical first review is: confirm the asset and scope; audit a sample of event records; recompute Availability, Performance, and Quality independently; inspect the largest verified loss at the equipment; and approve one bounded test with an owner and stop rule. If the raw data cannot be reconciled, repair the measurement process before interpreting a trend.
Reconcile a sample before trusting a dashboard
Take one shift and independently reconstruct the calculation from source records. Confirm that the scheduled window equals the agreed planned production time, subtract only downtime that meets the local definition, and compare output totals with production and quality records. For a mixed product run, sum ideal cycle time by product: (quantity A × ideal cycle A) + (quantity B × ideal cycle B), then divide by operating time. Confirm that rework is counted under the site’s approved output rule and is not counted twice as accepted production.
For the illustrative press-brake example, ideal production time is 380 minutes and operating time is 420 minutes, leaving a 40-minute difference. That difference is a Performance loss only under the stated assumptions. Inspect cycle and stop records to learn whether it reflects slower cycles, unrecorded stops, an inaccurate ideal cycle, or product-mix data. Do not immediately label it an operator-efficiency gap. If a machine reports output that implies more than 100% Performance, first verify the cycle standard, quantity, clock, and asset scope.
Keep the raw worksheet beside the dashboard for the first reporting cycles. Assign one person to calculate and a second to check formulas and denominators. When the equipment, product mix, or time policy changes, update the definition and annotate the trend. This reconciliation helps distinguish an operational change from a reporting change.
For the first review, put a sample event log, the factor calculations, and the proposed loss action on one page. Ask the operator whether the code reflects what happened, ask maintenance whether the work order supports the stated cause, and ask quality whether accepted output follows the approved disposition. Record disagreements and assign a data owner to resolve them. If the parties cannot reconcile the same event, mark the period as incomplete and avoid using its OEE as a performance comparison.
Keep the definition sheet with exported reports so later reviewers can reproduce the result. When two shifts use different stop thresholds or planned-time rules, show separate series until the process owner approves a common method; combining unlike data creates a trend that cannot support a sound decision.